In today’s data-driven world, the importance of data visualization cannot be understated. It enables us to make sense of vast amounts of information, identify patterns, and draw meaningful insights. While traditional 2D data visualizations have served us well, the advent of 3D data visualization has taken data analysis to a whole new level. In this blog, we explore the rise of 3D data visualization, its potential impact on decision-making, and the tools that are driving this transformative shift.
Evolution of Data Visualization: From 2D to 3D
Data visualization has come a long way from simple charts and graphs to sophisticated interactive displays. Traditional 2D visualizations, such as bar charts and pie graphs, have been the go-to methods for presenting data. However, as datasets have grown larger and more complex, the limitations of 2D visualizations became apparent. Enter 3D data visualization, which adds an extra dimension to data representation, offering a deeper understanding of information by adding depth and perspective.
The Power of 3D Data Visualization
Enhanced Spatial Understanding
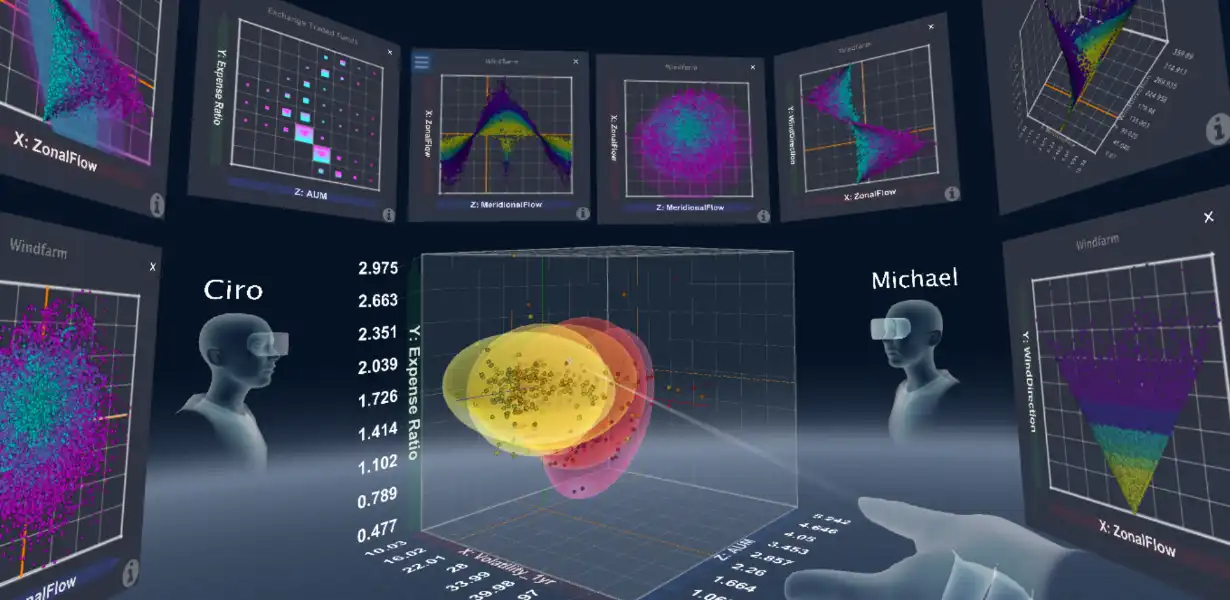
In 3D data visualization, data points are not restricted to X and Y axes; they extend along the Z-axis as well. This added dimensionality enables users to grasp spatial relationships between data points more intuitively. As a result, complex datasets can be explored with ease, leading to better insights and more informed decision-making.
Unraveling Multivariate Data
Traditional 2D visualizations struggle with representing multivariate data effectively. 3D data visualization overcomes this limitation by presenting multiple variables in a 3D space, where each axis represents a different variable. This approach facilitates the identification of correlations and patterns that might remain hidden in 2D representations.
Immersive Interaction
3D data visualizations often come with interactive features that allow users to manipulate and explore the data in real-time. This interactivity fosters engagement and empowers users to customize their views, gaining deeper insights and making decisions based on personalized perspectives.
Tools Driving the 3D Data Visualization Revolution
Tableau
Tableau has been a frontrunner in the data visualization industry for years, and it has also embraced the shift towards 3D. With features like “Show Me” and “Drag and Drop,” Tableau makes it easy to create compelling 3D visualizations without the need for complex coding.
Power BI
Microsoft’s Power BI offers powerful 3D visualization capabilities, enabling users to build interactive and immersive dashboards. With seamless integration with other Microsoft products, Power BI has become a popular choice for businesses looking to leverage 3D visualizations.
Plotly
Plotly is an open-source platform that provides a wide range of interactive data visualization tools, including 3D options. Its user-friendly interface and ability to handle large datasets make it a favorite among data scientists and analysts.
Impact on Decision-Making
Enhanced Data Exploration
The introduction of 3D data visualization allows decision-makers to explore data from different angles, facilitating a more thorough examination of trends and outliers. This deeper exploration leads to better-informed decisions and the ability to uncover hidden opportunities.
Improved Communication
3D data visualizations have a storytelling power that goes beyond traditional 2D representations. Decision-makers can communicate complex insights more effectively to stakeholders, fostering better understanding and collaboration.
Faster Decision-Making
With the ability to grasp complex information more rapidly, decision-makers can respond to challenges and opportunities in real-time. This agility is crucial in fast-paced industries where split-second decisions can make all the difference.
Final Words
3D data visualization is ushering in a new era of data analysis, enabling us to explore information in ways previously unimaginable. As the technology continues to advance and become more accessible, its impact on decision-making will be profound. Embracing this shift in data visualization will empower businesses to make smarter choices, gain a competitive edge, and unlock a wealth of insights that were once hidden in the vast sea of data.
Commonly Asked Questions
Q1. What is the main advantage of 3D data visualization over 2D?
3D data visualization offers enhanced spatial understanding, allowing users to perceive data points in three dimensions, providing deeper insights and a better understanding of spatial relationships.
Q2. How does 3D data visualization benefit decision-making processes?
By enabling faster data exploration, improved communication of insights, and facilitating real-time decision-making, 3D data visualization empowers decision-makers to make more informed choices.
Q3. Are there any risks associated with 3D data visualization?
While 3D data visualization provides valuable insights, it can also lead to information overload and misinterpretation if not used judiciously. It’s essential to strike a balance and focus on clarity and simplicity.
Q4. Which industries can benefit the most from 3D data visualization?
Industries dealing with complex datasets, such as healthcare, finance, and engineering, can particularly benefit from 3D data visualization due to the ability to analyze intricate relationships and patterns.
Q5. Is 3D data visualization accessible to non-technical users?
Yes, with the availability of user-friendly tools like Tableau and Power BI, non-technical users can easily create and interact with 3D visualizations, democratizing data-driven decision-making.
